This
was the first F24 Greenpower event of the season for us with Rotary
Racer RR8d. The drivers decided to use 6 drivers in the race. With the
higher than expected speed limits set by Greenpower in the Coorporate
Challenge we decided to look at improving the aerodynamics of the car
to increase the cars efficiency so we could go for a Platinum mileage award.. We measured and experimented with
reducing the cars rolling resistance, but could only find a slight
improvement from this. Gareth and Dan measured the car and Gareth
entered a more accurate CAD model in Pro/Engineer. We then tried this
model in the VWT and played around with a few ideas. One idea was to
pull in the rear end more after Gareth had talks with Bloodhounds
aerodynamisist. The VWT indicated that the two best improvements would
give us about a 10% reduction in drag, equivelent to about a 5%
improvement in speed. The team implemented these relatively minor
changes to the car for this race. We had a plan
to try and achieve a platinum millage award at this race. It worked !
We went about 4.2% faster in slightly higher wind conditions and at
about the same current as we used in the CC a couple of monts ago. We
managed
to win the race and achieve 127.2 miles in 4 hours giving us our first
platinum award.
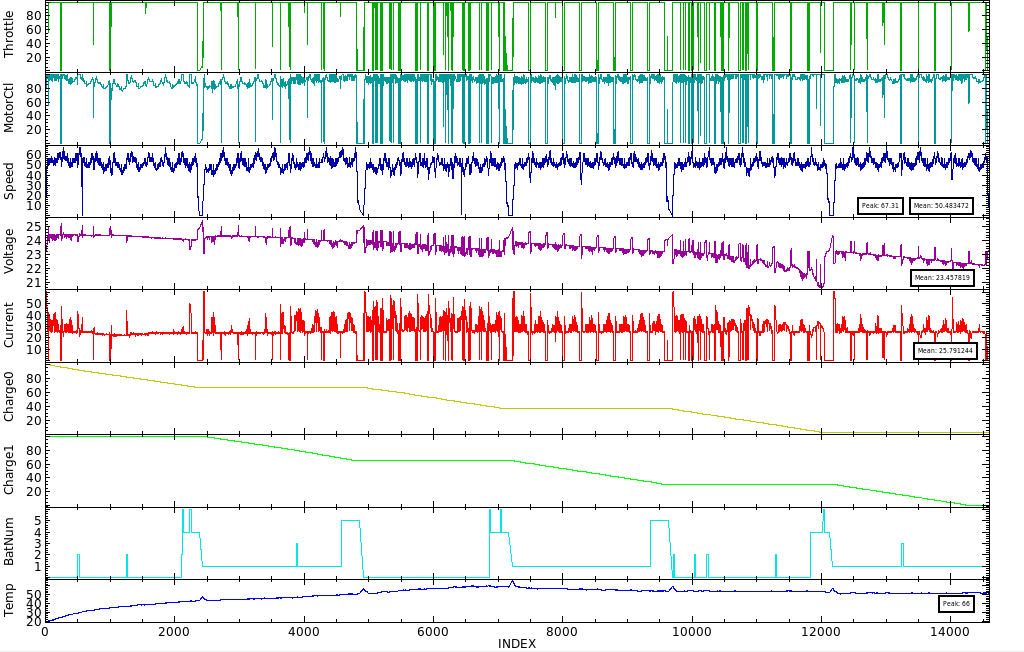
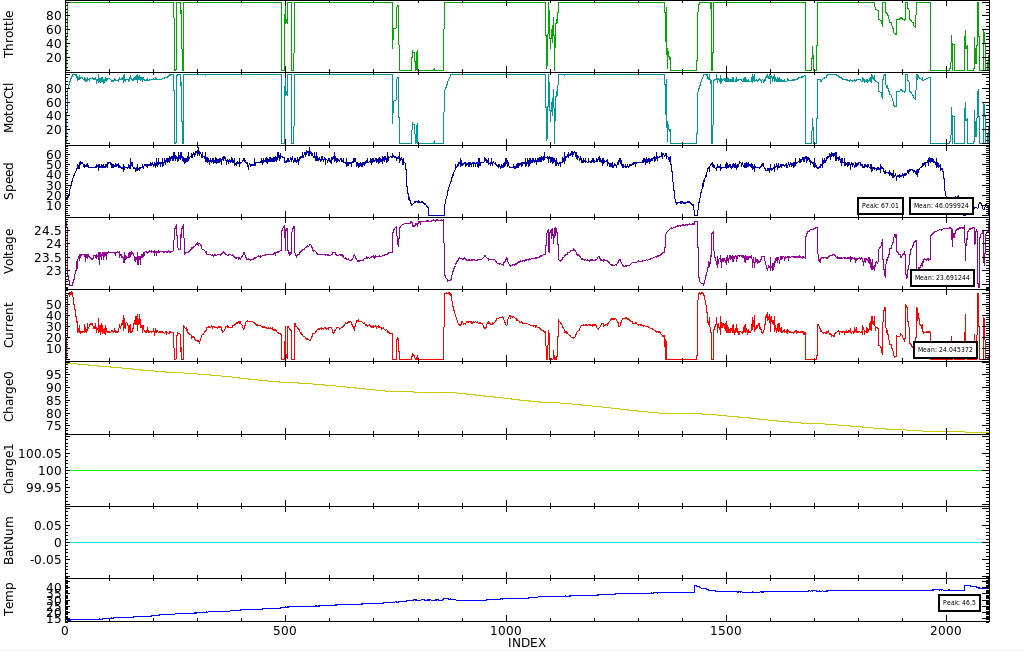
This shows the main items measured by the Rotary Racers car computer. They are:
| Item | Description |
|---|---|
| Throttle | The position of the twist grip throttle from 0 to 100% |
| MotorCtl | The motor power output setting. The Car computer sets the motor power based on the drivers throttle position, the speed of the car and the current being used. There is a software algorithm to implement this "drive by wire" system. The Car computer drives the PWM (Pulse Width Modulation) Motor Speed controller with a duty cycle proportional to this value. 0 - 100% |
| Speed | The speed of the car in Km/H calculated from the magnetic read switch pulse generator by the Car Computer. |
| Voltage | The batteries voltage under load. |
| Current | The current being taken from the batteries. |
| Charge0 | The charge left in the battery pack 0. This is calculated by the car computer using an algorithm that has been honed to match the battery discharge curves for the Yuasa batteries. It currently bases its results on the current being used from the battery. |
| Charge1 | The charge left in the battery pack 1. This is calculated by the car computer using an algorithm that has been honed to match the battery discharge curves for the Yuasa batteries. It currently bases its results on the current being used from the battery. |
| BatPack | The battery pack in use (0 or 1), the turbo button (2) and the Pitstop warning (4) . We generally change the battery pack with each driver change. |
| Temp | The Temperature of the motors casing in degrees C. |
| GPS |
GPS position, speed and time together with lap position information |
| Misc |
Other itmes describing the operation of the control system |
The graphs show the overall data, the actual ASCII data log files
are also available, from the links below, for detailed analysis.
These
are the battery voltages measured with a multimeter at the end of each
change. The readings were taken as soon as possible after the batteries
were taken out of the car and placed back in the battery area.
The batteries are very well balanced and we used each pack revalively equally.
| Battery Pack | BatA | BatB |
|---|---|---|
| 0 (RR12,RR15) | 12.51 | 12.51 |
| 1 (RR13, RR14) | 12.43 | 12.43 |
| 0 | 12.17 | 12.20 |
| 1 | 12.14 | 12.13 |
| 0 | 11.80 |
11.82 |
| 1 | 11.86 |
11.85 |