
Account
Pictures

Measuring, Measuring, Measuring
Greenpower Car Performance versus Battery Capacity
Terry Barnaby, 2009-11-25
This is an effort to provide information on how changing the battery capacity or race length will effect the performance of fast and slow Greenpower cars. The following uses basic mathmatics as presented in the technical info here to simulate two different Greenpower cars. The simulation uses the code in the Greensim simulator.
The simulation is pretty basic and does not account for a few factors. It is based on using power levels for the calculation. It assumes ideal gearing for the car and a car that keeps constant speed. This is similar to a fixed gear car although a fixed gear car would probably give slightly better figures (slows down a bit going into the wind and speeds up with the wind). There is a factor of 0.7 on the wind speed to componsate for this effect which make the figures close to the full simulation by Greensim.
The figures for car 1 is based on Rotary Racer at the final 2009, and matches data from the logs at races during the year quite well.
The figures for car 2 is the same as car 1 with slightly increased weight, rolling resistance, frontal area and Cd such that it manages an average of about 25MPH in low wind conditions.
There are two simulations, one with a 20Kph wind blowing and one with a 40Kph wind blowing on a circular circuit based on relatively hilly Castle Combe. Obviously the simulations may be wrong, but should be in the right ball park and they do match data logs for Rotary Racer at events this year,
With Wind Speed of 20Kph (12Mph)
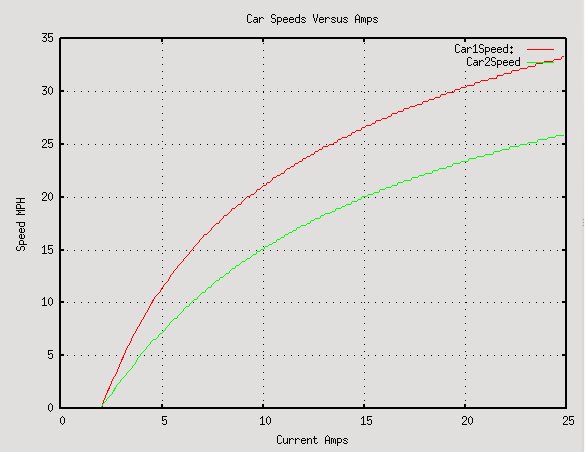
This is with a wind speed of 20Km/H (12Mph). The car parameters are as follows:
|
| ||||||||||||||||||||||||
With Wind Speed of 40Kph (24Mph)
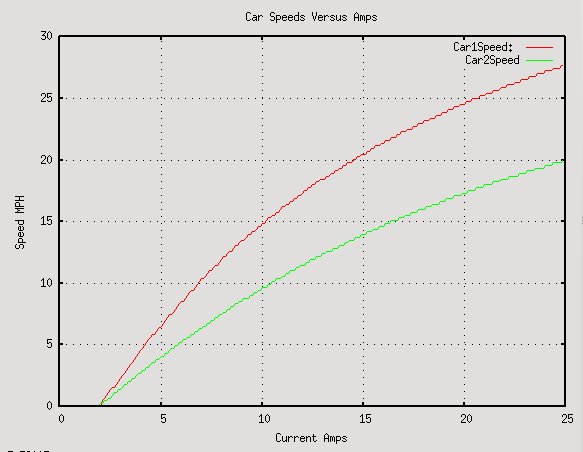
This is with a wind speed of 40Km/H (24Mph). The car parameters are as follows:
|
| ||||||||||||||||||||||||
Conclusions
These are obviously simulated and ideal figures, but are not that far from what we have seen from actual racing with Rotary Racer. It shows the following:
- That battery capacity has to be reduced quite a bit to reduce average speeds. With batteries limited to 25 degrees C and assuming an improvement of 5% on 2009 cars we would probably need batteries that could put out about 18Amps for 2 hours to keep the fastest cars average speed below 30MPH in low wind flat circuit conditions. As the current is lower the actual battery capacity to put out 18Amps for two hours would be even lower than expected due to the way batteries work (Peukert's_law).
- That the speed differential between fast and slow cars does reduce with battery capacity, but not by a huge amount.
- That even with a relatively high wind, slower cars should still be able to race well assuming their gearing is correct for the conditions.
An interesting item is the peak and minimum currents used by the two simulated cars running using an average of 24Amps and of 12Amps. Using the Greensim simulator on a fast and slow fixed gear car on a simulation of racing at the relatively hilly Castle Coombe on a windy day (40Kph) the following peak/min currents are calculated for using 4 batteries and two batteries (This assumes 12Amps for two batteries over 4 hours, actualy ignoring the Peukert's_law effect. In actual fact two batteries could probably put out 14 Amps for 4 hours):
|
| ||||||||||||||||||||
Assuming the gearing is correct for the car and race day conditions:
- The peak and minimum currents are the same for a slow and fast car. So motor overheat problems would be the same for both cars, as long as they are geared correctly.
- When the average current is reduced, the peak currents are also much reduced. The average along with peak current reduction means that the likelyhood of motor overheating is very much reduced.
Maths
The maths used for this is as follows:
The motors drive power, at a particular current, is calculated using the following equations:
torque = (current - 2.0) * 13.5 / 128;
rps = (13.5 - torque ) * 2000 / (13.5 * 60);
drivePower = driveEfficiency * torque * 2.0 * pi * rps;
The cars drag power is calculated using:
dragPower = (rollingDragCoeff * mass * 9.8 * speed) + (0.5 * airDensity * airDragCoeff * fontalArea * (speed * speed * speed));
A simple program first calculates the motors power for a particular current. Then it calculates the cars drag for different speeds until the dragPower is the same as the drivePower. The speed that this occurs at is plotted against the current used.
To simulate hills and wind the program actually calculates the average dragPower over 10 different locations around a circular circuit with the airspeed varying in a sinusoidal way and the car going up, then down the hill for 50% of the circuit at a fixed speed. The program was written in the Python computer language.